RVs, the Economy and You! UPDATE #2, Part Three

Below is a transcript of his video and here is a link to the full video explanation.

Welcome National Indoor RV Center’s family of customers and friends to RVs, the Economy and You! UPDATE #2, Part Three. 

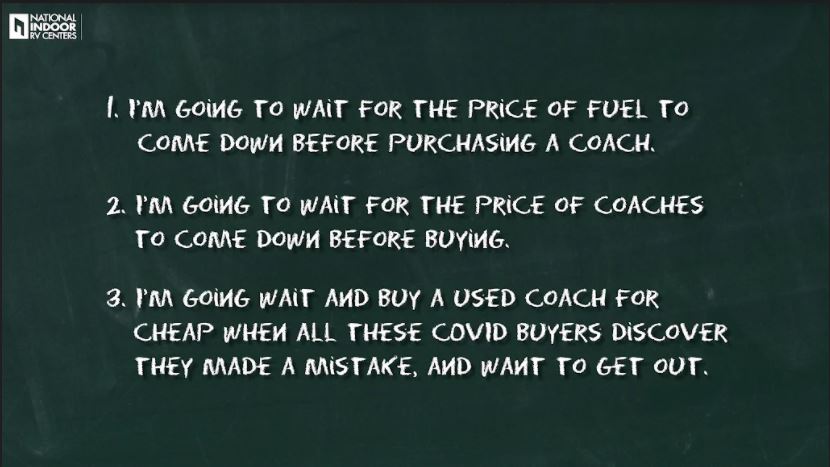
In Part Three I want to share my thoughts, and question the logic of the following three statements I am repeatedly keep getting asked, and I keep reading about on the Forums:

1. I’m going to wait for the price of fuel to come down before purchasing a coach.

2. I’m going to wait for the price of coaches to come down before buying.

3. I’m going wait and buy a used coach for cheap when all these COVID buyers discovery they made a mistake, and want to get out.

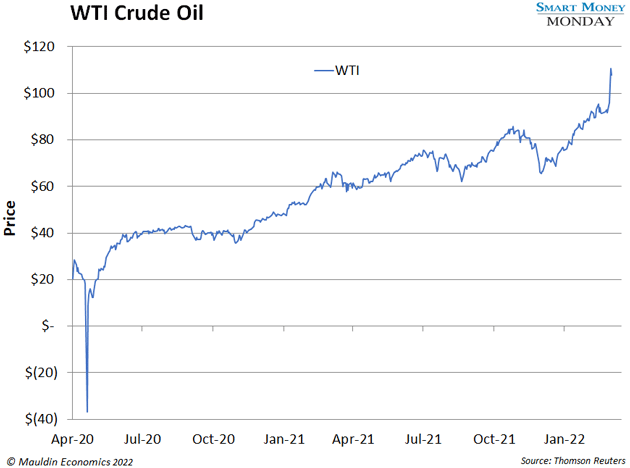
Personally, I don’t believe oil will drop below $100 per barrel anytime soon. Yes, oil spiked reaching an 8 year high, and everyone is pointing to Russia’s invasion of Ukraine. It makes sense. Russia is the world’s third largest producer of oil, and the top exporter to global markets. Russia produced 12% of the world’s oil last year, with 60% of its oil going to Europe. Now the west is refusing to do business with Russia, which crimps supply, hence the recent spike. But, if we zoom out we see prices have been on a choppy upward march since April of 2020.

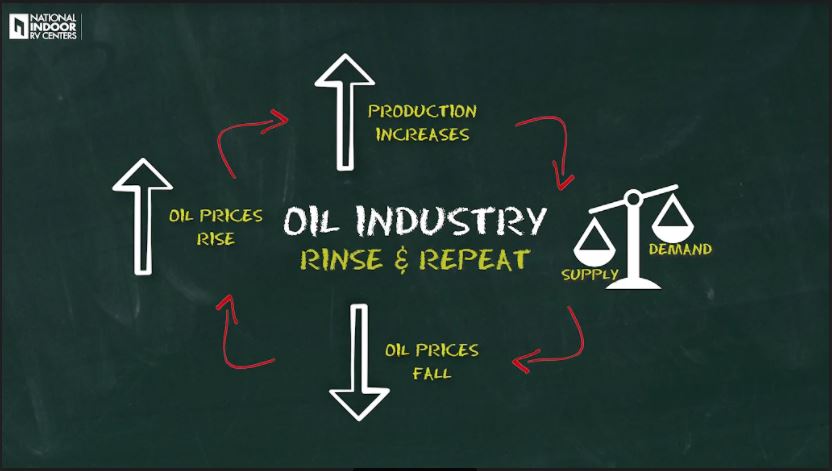
As I previously mentioned, I believe $100 plus oil is here to stay for awhile, and it’s not just because of Russia. The oil industry runs in cycles. When oil prices rise, production increases, supply exceeds demand, and then prices fall. Rinse and repeat. As the saying goes, the cure for high prices is high prices.

The problem is production hasn’t increased much this time around. One of the best indicators of oil production is the Baker Hughes international rig count, which measures the number of active drilling rigs around the world.

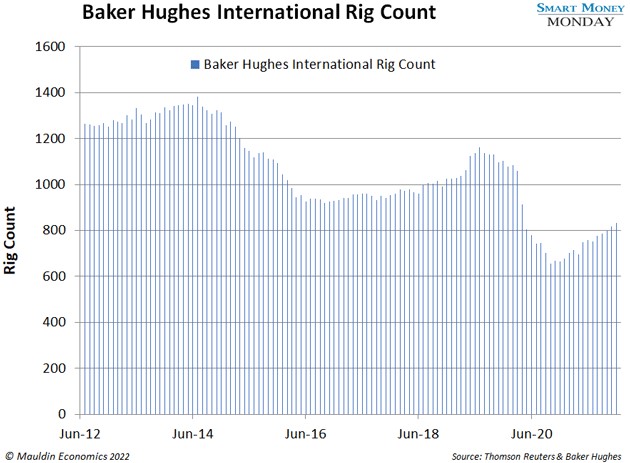
As you can see from this chart, the rig count is currently hovering around 840. That’s 38% lower than the 10-year peak of 1,350. The last time we saw $100 per barrel it lasted 41 months from March of 2011 to August 2014, and the mood was “drill baby drill.”

Today the mood is different. Everyone’s looking to green energy, and the oil producers have no plans to ramp up production. Their spending plans changed after the last bear market in oil. Instead of plowing money into exploration and production, they’re returning cash back to their shareholders through dividends and share repurchases. BP, Exxon, and Chevron plan to spend between $38 and $41 billion in share buybacks just this year alone. That’s one whale of a lot of money not going into exploration and production this year!

Now turning to demand, I realize there are some who say we won’t even need oil in the future. But, that future isn’t coming tomorrow. By way of full disclosure, I live full time in, and drive a coach that gets 7 miles per gallon of diesel. In an attempt to balance out my carbon footprint, I also drive a Tesla. So, I am a fan, and a consumer of both a diesel powered coach, and an electric vehicle. And, I love both of them equally, but realistically oil is not going away in my lifetime.

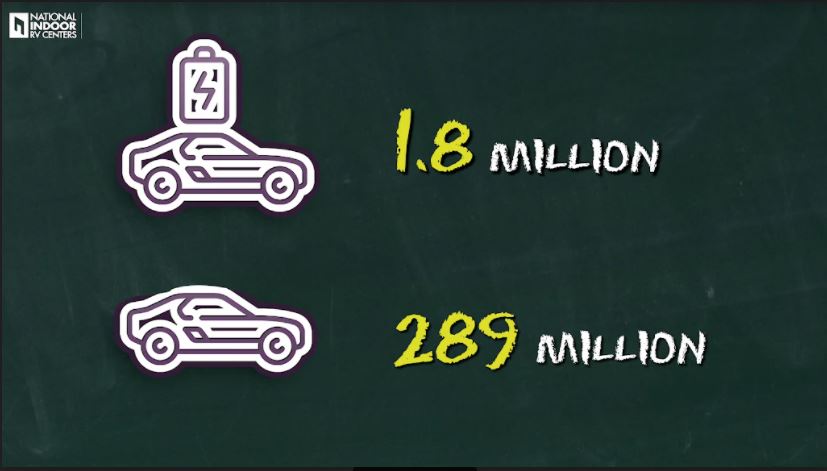
There are currently 1.8 million electric vehicles registered in the United States today versus 289 million registered cars. Electric vehicles make up a little over one half of one percent of all the passenger vehicles on the road today. Even if electric vehicles grew to 5% of the passenger market, which will happen someday, it still won’t dampen oil demand by much. And remember, we haven’t even mentioned the oil consumption for commercial trucking, busing, airlines and so on. 

I don’t believe coach owners will stop using, or purchasing coaches because of fuel prices. I believe they will once again do what I did as coach owner, and what I observed our customers did the last time fuel prices were high. They will still take just as many trips, but those trips will be in-state, or to a neighboring state, instead of the cross country trips they enjoyed when fuel prices were low. Instead of traveling to, and staying in several resorts, or parks on a trip, they will simply stay longer, and visit fewer resorts on the same trip. Or, they will simply hedge the cost of their fuel by investing in oil stocks, and let their stock gains more than offset the increase in the cost of their fuel. What they didn’t do, and what I don’t intend to do, is to stop living the lifestyle, or put off purchasing a coach because of fuel prices. Time will tell if history repeats itself this time around or not I guess.

Turning to the question of waiting for coach prices to come back down. Now, here I do have a couple of thoughts, and the first one is, I don’t believe the prices of new coaches will come down. In fact, I believe the price of new coaches will continue to go up.

Coach manufacturers are really what I term to be “parts assemblers.” And, I just don’t see the cost of all the parts, components, and raw materials they use to assemble a coach coming down in price.

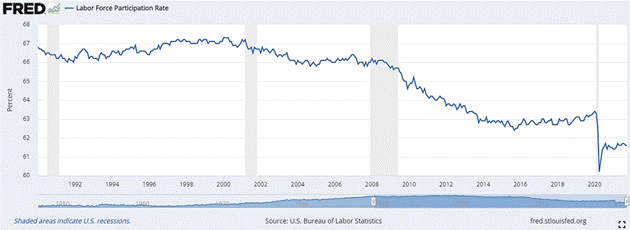
First, there is an awful lot of labor involved to manufacturer every part, and component used in the assembly of a coach, and then more labor to design, engineer, and assemble the coach. For the reasons I previously discussed in my RVs, the Economy, and You! UPDATE #2, Part Two video, I can only see the cost of labor going up, and there’s not a swinging thing anyone can do about it. The problem with labor shortages was baked in long time ago when our birth rates, and immigration rates started declining. Basically, when we stopped replacing ourselves.

Now from tires, to plastics, to shipping, there is a lot of fuel and petroleum based components and materials used in the assembly of a coach. And, for the reasons I just discussed a moment ago, I don’t see the cost of oil coming down anytime soon.

Bottom line, in absolute dollars, I don’t see the price of new coaches coming down. Rather, I see the rate of price increases, the rate of inflation if you will, slowing down as the supply chain sorts itself out, production rises to meet demand, and higher prices tamp down demand. But, I really don’t believe I will see a lower invoices on new Dutch Stars going forward.

Now for my second thought. Whether you are still working, or you’re retired living off your portfolio, coaches are more affordable today than they were 5 years ago. Please, before you scoff, and stop watching, allow me to explain why.

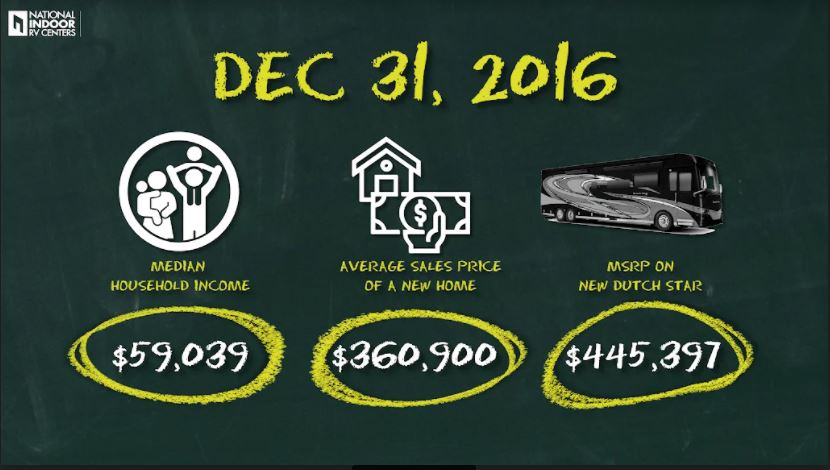
Let’s look at this in relative, and not absolute terms. At 12/31/2016 the median household income was $59,039, the average sales price of a new home was $360,900, and MSRP on a new Dutch Star was $445,397. 

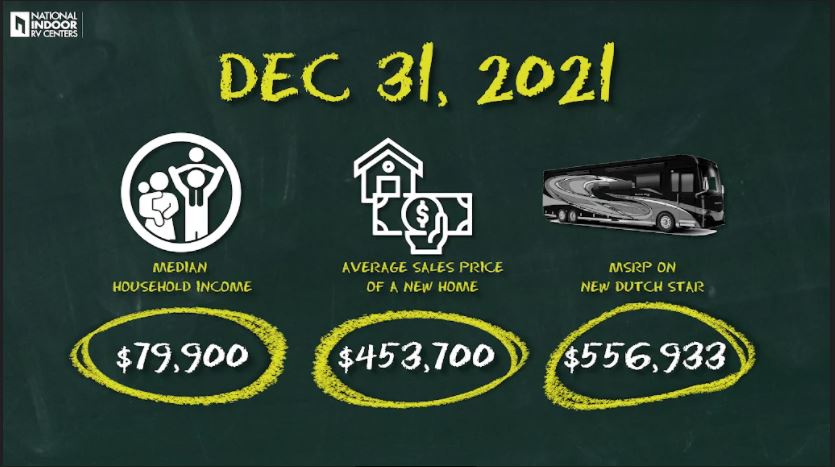
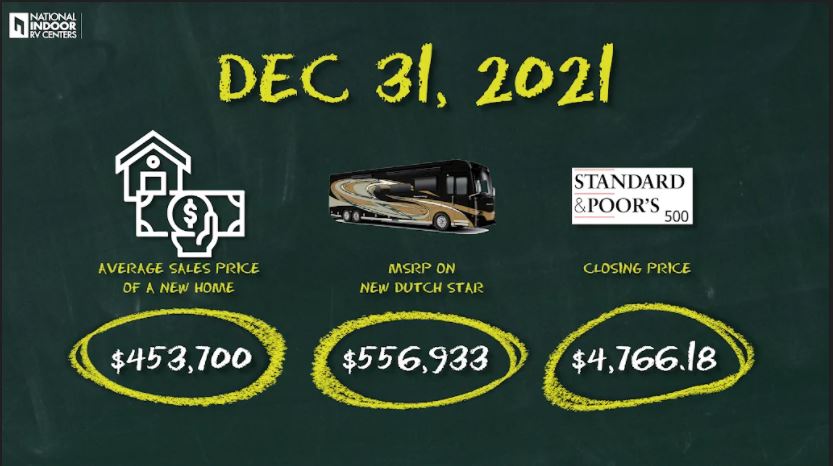
Now, let’s take a look at these same data points at 12/31/2021, or just 5 years later. The US Department of Housing and Urban Development estimates the median household income was $79,900, the average sales price of a new home was $453,700, and MSRP on a new Dutch Star was $556,933.

In relative terms a new home on 12/31/16 cost 6.11 times the median household income, and the Dutch Star’s MSRP was 7.54 times the median household income.

By 12/31/2021 a new home costs 5.68 times the median household income, and the Dutch Star’s MSRP was 6.97 times the median household income.

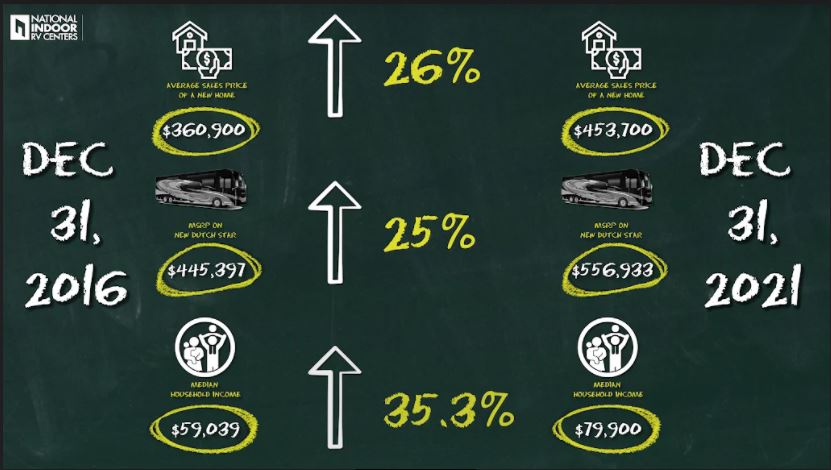
How can this be? Well, the sales price of a new home went up 26%, the MSRP of a Dutch Star went up 25%, and the median household income went up 35.3%. Not with standing all the price increases, “Stuff” is more affordable today than it was 5 years ago because wages, or as an employer, labor is rising faster than either goods or services right now. How much of this increase in median household income is due the government’s monetary policies, and how much is due to the shortages in labor those policies created, remains to be seen. But, one thing is for sure, with a shrinking pool of labor going forward, wages are going to continue to go up.

It would be irresponsible of me not to point out the obvious, which is no one pays MSRP for a new coach. Ever! I trust and hope all of you know I’m restricted and only permitted to discuss MSRPs, and not disclose invoice amounts. But, the manufacturer’s markup from invoice to MSRP hasn’t changed over those five years, so the rate of inflation for a Dutch Star is accurate. We are still talking “apples to apples” when compared to the rate of inflation for houses, and household incomes.

Now, not everyone is still working. Many of you are retired, so this comparison of prices to household incomes is irrelevant to you. So, let’s take a look at housing, and coach prices relative to your investment portfolios.

At 12/31/2016 the average sales price of a new home was still $360,900 as previously mentioned, and MSRP on a new Dutch Star was still $445,397. And, the S&P 500 closed at 2,238.83.

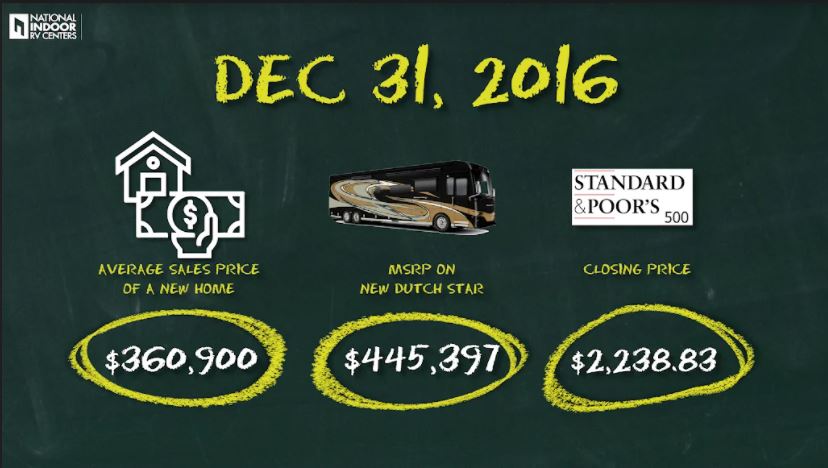
5 years later on 12/31/21 the average sales price of a new home was still $453,700, and MSRP on a new Dutch Star was still $556,933, and the S&P 500 closed at 4,766.18.

Again, in relative terms a new home on 12/31/16 cost 161.2 times the closing price of the S&P 500, and the Dutch Star’s MSRP was 198.94 times the S&P 500.

By 12/31/2021 a new home costs 95.19 times the closing price of the S&P 500, and the Dutch Star’s MSRP is now down to 116.85 times the S&P 500.

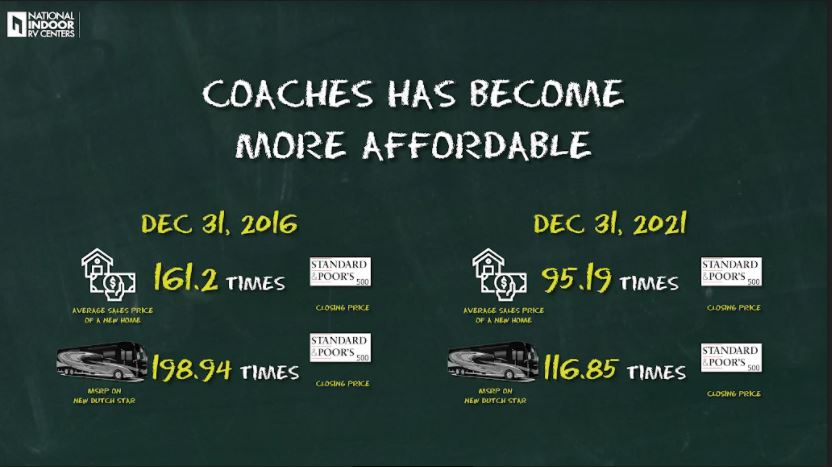
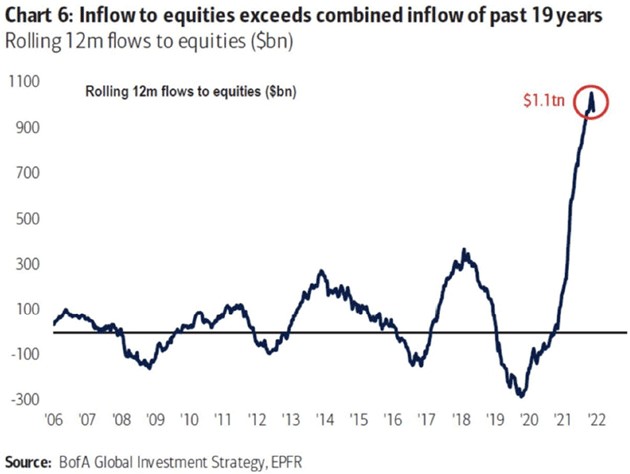
So yes, coaches have become even more affordable for those who are retired, and living off their investment portfolios, than those of us who are still working. Again, no big surprise here. As I mentioned in my last video, Quantitative Easing did nothing for the bottom 65% of Americans. From 2008 to today, Quantitative Easing has been a massive stimulus package to assets in general, and the stock market specifically.

Just as a point of interest, the S&P 500 would have to drop to 2,799, or a 41% decline from 12/31/21 closing price of 4,766 before coaches would be as affordable today as they were on 12/31/16.

Now moving on to addressing our last point, which is “I’m going wait and buy a used coach for cheap when all these COVID buyers discover they made a mistake, and want to get out.”

Well it’s been two years since the Pandemic hit, and we’ve not seen any of these COVID buyers regretting the RVing lifestyle. Nor do I think we will see them for two reasons.

First, as I pointed out in my video “RVs, the Economy and You! UPDATE” from June of last year, most of the demand for new coaches was created by a lack of supply. For two months the manufacturers were shut down, and then when they did reopen they were hit with supply chain shortages, and rolling labor shortages due to quarantines. The vast majority of buyers for new coaches were already coach owners, or had been planning and saving to live the lifestyle when they retired. My point, new coach sales went to very few COVID buyers. They went to buyers who were already in the lifestyle, or had planned for years to be in the lifestyle, and those folks aren’t regretting their decisions. Those coaches haven’t, and in my opinion, are not going to be regurgitated back into the market. The notion of being able to purchase a late model, slightly used coach for a steal, hasn’t, and probably isn’t going to pan out. 

My second reason is, the COVID buyers who did purchase their first coach because of the Pandemic, did so in a used coach. There were 5 times more used coaches on the market when the Pandemic hit that there were new coaches. And, the ratio hasn’t reversed. There are still more used coaches on the market than new.

As I pointed out in my video last summer, the value of used coaches had skyrocketed when compared to new coach prices. Existing coach owners recognized the arbitrage opportunity, and upgraded, because they already had a coach to upgrade from. They were able to take advantage of the high used coach sales price on their current coach and purchase a brand new one for cheap. On the other hand, COVID buyers purchased used coaches at inflated prices relative to new coaches. And, a much higher percentage of used coach buyers finance their purchases than do new coach buyers.

My point here is, I’m still not seeing the regret among COVID buyers every bargain hunter out there is hoping to see. And, if there is regret among some, unfortunately, they’re trapped. After a two year run, Book Values finally declined in the most recent Book change. Which means, these yet to be seen COVID buyers who are regretting their decisions, are now underwater on their coaches, and will have to write big checks to the bank in order to get out from under their coaches. For those few who may be regretting their decision, I suspect they will find it financially more palatable to just keep making their monthly payments, and learning how to enjoy living the lifestyle, versus writing a big check they probably don’t have. Or, they wouldn’t have financed to begin with.

I would like to close out this series of three videos with some personal thoughts. No data, no numbers, nothing to back what I’m saying up. Just my feelings. 

I feel the Fed’s cheap-money policies have essentially created an environment which financializes everything. It encourages companies to buy their competitors instead of innovating, and delivering better products at lower prices. I personally feel that’s unfortunate, and not how a I would like to see a free economy work.

And lastly, I hear almost on a daily basis comments along the lines of “I’ve never seen a trailer hitch on a coffin,” or “I’ve never seen a Brink’s truck in a funeral possession.” For me, I have lived the RVing lifestyle now for 37 years, and for two different reasons.

When the kids were young, I loved the all time we spent together in the coach. I loved having them captive as we drove down the road, and thankfully cell phones didn’t exist for them. We were in our own little world, far away from their friends and from my business, every night in the coach somewhere in our beautiful country. And, now I have those memories to treasure forever. As I look back over my life, I’m so glad I spent both the money and the time to make those memories, because I don’t get a “do over” with my children.

Now as an empty nester I have been fulltiming since 2013 for a different reason. I believe money and power reveal. They often unmask a person. Sometimes we like what is revealed, and many times we don’t. Throughout my career I have spent a fair amount of time around wealthy people, and I haven’t observed an extra dose of happiness in them. Money solves money problems, but it doesn’t make people love you; our actions do. And, that is why I love the RVing lifestyle. There simply isn’t a nicer, more loving community of people out there than RVers, and they truly show it through their actions everyday.

I want to thank all of you for taking the time out of your lives to listen to my thoughts. I hope you come away from these three videos feeling as I do which is, weather change occurs slowly in our lives or if it’s heaped upon a sudden, the sky isn’t falling, for most of us we are financially better off in our lives today after the pandemic than we were before the pandemic. I also hope these three videos will prompt you to look at the world around us in relevant terms and not in absolute. I wish all the best and thank you for watching!

RVs, the Economy and You! UPDATE #2, Part Two

Below is a transcript of his video and here is a link to the full video explanation.

Welcome National Indoor RV Center’s family of customers and friends to RVs, the Economy and You! UPDATE #2, Part Two. 

In Part Two we’re going to discuss a little history, along with the following six topics:

1. Monetary Policy 1 (MP1)

2. Monetary Policy 2, or “Quantitative Easing” (MP2)

3. Monetary Policy 3, “Helicopter Money” (MP3)

4. Supply and Demand

5. Labor Force Participation (LFP)

6. Stock Market

Let’s discuss the three stages of monetary policy, starting with what’s referred to as Monetary Policy 1, or MP1.

For decades MP1 was the primary monetary policy. MP1 is the practice of modulating interest rates to affect the economy. For decades these changes in interest rates worked, because they impacted so many things. By reducing interest rates the Fed was able to stimulate the prices of financial assets, which led to more wealth-effect induced spending, it increased debt-fueled capital investment, and reduced borrowing costs. By increasing interest rates the Fed was able reduce demand, and reduce inflation.

For those of us who are old enough, I’m sure you’ll remember our nation’s rate of inflation during the 1970s, and early 1980s. Inflation peaked at 14%, the Prime Interest Rate hit 21.5%, and the unemployment rate reached 10.8%.

The Federal Reserve, lead by Chairman Paul Volcker, raised the Discount Rate, the rate banks could borrow from the Fed to 14%, and raised the Fed Funds Rate, the overnight rate banks lend to each other, to a whopping 20%! Think about that for a minute. If you’re a bank, and have the opportunity to lend your money overnight at no risk, and earn 20% per annum, what interest rate would you need to earn on a loan in order to entice you to take on the risk of the loan? 23%? 24%? 25%? Clearly, lending ground almost to a halt, which thwarted demand, and the rate of inflation came down fast, dropping to 3% by 1983. 

Bottom line, under MP1, interest rates were the driver used to change the levels of borrowing, and lending in order to alter spending habits. If you remember, we used to see 3 to 5 percent interest rate changes in order to move our economy. But, when short-term interest rates near zero, as they did following the 2008 Financial Crisis, MP1’s effectiveness was greatly reduced. Enter Monetary Policy 2, or MP2, or Quantitative Easing, or QE for short.

During the Great Recession our economy was very weak, inflation was reasonably low at 3.84%, and interest rates, specifically the Fed Funds rate, were approaching zero, as it stood at 0.09%. Our country was in a financial crisis! There was no room for the Fed to lower interest rates to stimulate our economy. They were already near zero! Credit had completely dried up. The government sponsored mortgage enterprises FNMA and FHLMC we’re taken over by the government, money markets were “breaking the buck,” ships weren’t docking to unload their cargo, because our global trading partners didn’t trust our bank’s Letters of Credit guaranteeing payment for their goods, and I could go on, and on. The Fed needed to stimulate credit, and stat! The Fed responded by purchasing long term treasury bonds, and non-treasury securities ranging from mortgage backed securities, commercial paper, plus a plethora of other types and classes of securities. The Fed’s change in policy from purchasing only treasury securities during its Open Market Operations, to purchasing all types of securities, and in never before seen amounts, was called Quantitative Easing. And, Quantitative Easing has continued unabated since the Financial crisis of 2008 to today. They’ve never stopped purchasing large amounts of securities.

With the Fed having been so accommodative under both Monetary Policy 1, and Monetary Policy 2 since the Great Recession, you might be wondering, why didn’t we see inflation? 

Well, we did. We’ve seen a lot of inflation in assets. Think of the tremendous gains in the Stock Market, the prices of homes, and real estate. But, none of us complained about our assets increasing in value. And then, suddenly, the Pandemic hit, and ushered in Monetary Policy 3, or MP3, or more commonly referred to as “Helicopter Money.”

When the Pandemic hit the Fed had already tapped out MP1. Interest rates were already near zero. Again. The Fed Funds Rate on March 15, 2020 was 0.25%. Likewise, when it comes to MP2, the Fed had never stopped purchasing assets. The Fed wasn’t fighting inflation which stood at 2.5% in March of 2020. The Fed wasn’t dealing with a crisis of credit this go around. Working in concert our government and the Fed needed to create demand in order to avert mass poverty. 

The mechanics of combined monetary stimulus from the Fed, and fiscal stimulus from Congress, was inherently inflationary. MP3 created demand without creating any supply. “Helicopter Money” more than made up for the incomes lost to widespread shutdowns without making up for the supply those incomes had been producing. The Federal Government put $6 trillion dollars directly into the hands of consumers, much of it regardless of need. Remember the Paycheck Protection Program, unemployment checks, stimulus checks, and the list goes on. While at the exact same time state and local governments restricted many retail and servcie businesses from opening. Unable to spend on services, and experiences, we sat at home with with all the stimulus in our pockets, along with some of the lowest interest rates in history, and we bought STUFF! We demanded more goods than our logistical infrastructure had ever produced or delivered. 15% more!

Voila, supply shortages. Throw in supply chain problems, and we have inflation in goods. Demand for services hasn’t fully recovered, but it’s sure headed that way fast!

All the government stimulus has put cash in our pockets, and Quantitative Easing has raised asset values. Interest rates are low. However, one consequence of inflation is it pushed “real” interest rates lower. Depending on which benchmark you use, short-term interest rates are now hovering around -6%. If the Fed follows their recent practice, and raises rates 1/4% at each of their meetings starting mid-year June, it might add up to a 1.25% interest rate hike by the end of the year. If inflation continues, it will still leave us with negative real interest rates of -3%, which is still incredibly accommodative. This is the box the Fed is currently in. They will have to stop Quantitative Easing, and raise the Fed Funds rate 3%, or more just to get real interest rates to 0%. I suspect if the Fed were to really do this, we would see a financial temper-tantrum on steroids.

I’d like to point out, raising interest rates will have real consequences. Clearly, higher interest rates would raise borrowing costs for the biggest borrower of all, the US Treasury. Our nation’s debt has reached such a size, even tiny interest rate increases add very large dollars to our budget deficit, and debt. And, no one goes unscathed. Think of all the adjustable rate mortgages, business lines of credit, car loans, and more tied to Treasury yields, the prime rate, or other benchmarks. Real interest rates might still be negative, but higher rates will reduce liquidity, and push over leveraged borrowers, of which we have many, into default.

Strangely, the inflation the Fed is trying to fight wasn’t caused by them, and their tools are insufficient to fight it. Yes, the Fed’s Quantitative Easing had an impact on asset inflation, and especially the stock market. QE has been a massive stimulus program for Wall Street, and the stock market, but it did absolutely nothing for the bottom 65% of Americans.

Quantitative Easing changed almost nothing but asset prices in the financial markets, and low interest rates on car loans and mortgages. And yes, those low interest rates have reduced our debt service costs, which has freed up more cash, which has also added to demand. And, all of that is on the Fed.

But, actual inflation? I’m sorry, but that’s all on Congress, and the “helicopter money” they showered on our citizens. The Fed can accommodate Congress by buying the government’s debt, but it shows right back up on their balance sheet. The point is, it’s not “hot money.” The multiple stimulus packages passed by Congress were “hot money” on steroids. It went straight into the hands of people who, how dare they, actually spent it. And, since they couldn’t spend their “helicopter money” at restaurants, hotels, and travel, they bought “stuff!” So much “stuff” we had demand shock. Consumers wanted more than businesses could or have produce.

But, hold the phone, there’s still more. COVID had a very serious impact on supply, too. When employees can’t come to work, shortages start to build up very quickly. Think chips for example. Additionally, businesses were facing wage inflation, and higher costs for their raw materials, or components. So, they raised prices, sometimes because it was justified, and sometimes simply because they could. It’s interesting to note, profit margins for the largest companies in the US are at all-time highs.

Cummins Diesel said they will be dealing with chip shortages two more years. Cummins buys run-of-the-mill, low-end chips. Chip fabricators do not want to build a factory to manufacture low-end chips when the demand for those chips will not be there two, or three years from now. They want to see 10-year horizons. I suspect it’s exactly the same for multiple businesses all across the spectrum. Businesses see an initial demand created by the massive stimulus from Congress, supply chain disruptions caused by COVID, and realize things will probably settle out, and building another production line today will not be useful when demand evens out two years from now. It’s just going to take us some time to sort through the demand and supply shocks. And, there’s not a swinging thing the Fed can do with their policy tools to fix the root cause of inflation created by our Congress with all their stimulus.

To be clearer, I am by no means saying the Fed should be let off the hook. The Fed’s Treasury bond purchases, and interest rate manipulations did facilitate excess spending. Similarly, their mortgage security purchases did propel the housing boom, which is adding to inflation. It is a very good thing the Fed is now slowing the pace of their purchase, but personally they probably should have done it a year ago.

I suspect price inflation will continue until the supply chain catches up with demand, or fiscal and monetary policies tighten enough to reduce demand. We all want more, and thanks to MP1, MP2, and MP3, most of us can afford more. And, we’ll continue to party before the punchbowl runs dry, but run dry it will, for a reason no one can control. Enter labor force participation. 

Our country’s Labor Force Participation, not unemployment, is the big concern. Because, no one can control it. After rising for decades, our labor force participation rate peaked at 67.3% in January 2000, and is currently 62.3%.

As we progress through the decade of 2020, the decline in our country’s labor participation rate is going to accelerate. The driver… the large population of aging Baby Boomers. Between the ages of 65 and 74 the Labor Force Participation rate is around 30%, but at age 75 it drops to 10%. Last year, 2021, the large 1946 born contingent of Boomers hit 75. Now, for every year going forward this large horde of workers will be leaving the workforce.

“Where did all the workers go” is a recurring question I keep hearing. Why did everyone leave the works force and not come back during the COVID era? With this chart, I can partially answer the question. 

The blue line shows retirees as a percentage of the US population. As you would expect, it turned higher after the first Baby Boomers turned 65 in 2010. The red line is merely a smoothed trend for the period post 2010.

Then came 2020, and we see by the red arrow a sharp jump in the percentage of retirees above the previous decade’s trend. I would submit to you this jump in retirees wasn’t health, or death related. Thanks to the monetary policies of the past 14 years, I suspect a very large percentage of these retirees saw big gains in their portfolios as the stock market surged, and decided they could retire earlier than they had previously planned. 

On this chart the percentage may look small, but this divergence represent something like 3 million “excess retirees” above what the prior trend predicted. That represents very significant shrinkage in our labor force in just a single year.

Couple it with the Boomer generation, who once blasted hiring managers with hundreds of resumes for every opening, are now leaving the workforce, one way or another. And, unfortunately, subsequent generations are smaller, because birth rates and immigration fell. Add in the effects of COVID, and we now have a severe labor shortage.

I don’t believe we’ve processed how profound this change is going to be. Because workers are scarce relative to demand for their services, they have more influence. They can demand, and receive higher wages. This is clearly inflationary.

At the very same time we’re awash in available investment capital, which greatly exceeds the demand. This is one reason interest rates have been persistently low. If you want to earn interest income by lending your capital, you are competing with many others who want to do the same. Borrowers will naturally choose the best terms, and so it’s a race to the bottom.

Bottom line, I believe we are shifting from a capital-constrained economy to a labor-constrained economy, and I don’t think this will be temporary. Naturally, we’ll see ebbs and flows, but this is generally the way it’s going to be for a while. I know I’m spending little, to almost no time looking for capital, but I am spending a lot of  time finding finding human capital. And, I don’t believe I’m the only CEO experiencing this. The tech world has been dealing with this for some time. Now, it’s becoming the norm for every sector.

Now, let’s discuss the stock market for a minute. I think this chart speaks volumes about  about the effects of MP3. This chart shows year-over-year money flows into equities. 

You can’t help but notice the recent change. Cash inflows into equites for the past year exceeds all the inflows of the prior 19 years combined! Needless to say, this is not normal. And, all this incoming cash raised valuations.

Let’s look at Crestmont Research’s Real Price to Earnings chart for the S&P 500. I prefer the Crestmont P/E ratio to the standard P/E ratio, because it’s based upon the historical relationship between earnings per share and gross domestic product. This chart covers the time period 1871 through February 2022.

The Crestmont Price to Earnings ratio of 38.9 at the end of February 2022, was 164% above its average, and at the 99th percentile of this 14 plus decade series. Our current rally started in early 2014, but notice the two months in 1929, the tech bubble of 2000, and the end of February 2022. All three had Price to Earnings ratios above 25.

You don’t have to be a rocket scientist to know both inflation, and deflation are not good for stock investments. Historically, the “sweet spot” has been when inflation was between zero and 3%, and at much lower valuations. Depending on how you measure standard deviation, we are currently 4 standard deviations from the mean, which is higher than the Roaring 20s, and the tech bubble of 2000. By the way, a standard deviation of 4.0 would occur once every 31,560 days, or about 1 trading day every 126 years.

All of this suggests one of two things needs to happen. Either inflations needs to drop, or the stock market needs to drop, or some combination of the two. 

This will probably be a different investing environment than most of us have ever known, because as investors, we won’t be in the driver’s seat anymore. Companies who need debt or equity financing will have many options. As investors, we will have to give them a reason to choose us, which will boil down to price and yield.

I believe the large funds will have even greater problems. And, currently underfunded Pension Funds are having to invest in overvalued markets, which will swing to undervalued at some point, possibly right as those plans need cash to pay benefits. Folks who are counting on one of these many underfunded plans for their long retirement may want to start making alternative plans.

Now, I’m sure the question you are waiting for me to go out on a limb and answer is: Are we going to have a bear market? And, my answer is certainly. But, like you, I’m not sure when. However, I would like to make two points.

First, the total return of the S&P 500 has been 10.5% per annum since its inception in 1957. There have been 26 bear markets since 9/7/1929. The longest bear market lasted 630 days starting 1/12/1973, and the shortest bear market lasted 33 day starting 2/19/2020, with the average bear market lasting only 289 days. My point here is, with bear markets averaging only 289 days, it’s easy to see why many an investor have underperformed the market by trying to time the market.

Secondly, we may already have a bear market occurring within the S&P 500, and please allow me to explain. While the S&P 500 is made up of 500 companies, 8 companies, which I’ll refer  to as the “MegaCap-8,” account for 50% of the total market capitalization of the S&P 500. Think about that for a minute. 8 companies, not 250 companies, account for half the total value of the S&P 500. In fact, since 2012, those 8 companies produced a total return 5.6 times greater for their shareholders than the other 492 companies combined produced for their shareholders. If you’re curious, those 8 companies are:

1. Alphabet (Google)

2. Amazon 

3. Apple

4. Meta (Facebook)

5. Microsoft

6. Netflix 

7. NVIDIA

8. Tesla

As of March 4th, 2022 those 8 stock’s sported a Price to Earnings ratio 66% higher than the Price to Earnings ratio of the other 492 companies combined. Long story short, significant portions of the market are already in bear market territory, but the S&P 500 is still being held up by the “MegaCap-8.” This is one of those times “friends don’t let friends buy index funds.” This isn’t a normal business or credit cycle. This is truly a unique economic environment, and I suspect a rifle will outperform a shotgun when it comes to stock returns for the balance of the 2020s.

And with that, I’m going to end this video here. Thank you for watching and if you’re still in need of a sleep aid, please watch the third video in this series for some conclusions to all the groundwork laid in these first two videos.

Thank you for watching, and I wish you all the best!

RVs, the Economy and You! UPDATE #2, Part One

Below is a transcript of his video and here is a link to the full video explanation.

Greetings National Indoor RV Center’s family of customers and friends. 

Yes, I’m back with three more videos, which means three more nights of good sleep for you. And, if you find it difficult to concentrate, and follow my Ben Stein’s “Bueller, Bueller, Bueller” monotone presentation, I do understand. Heck, I put myself to sleep when I have to re-watch myself after the editing is done. Unfortunately, just like a zebra can’t change its stripes, at my age I certainly can’t change mine either. Regardless, I hope you will find the information interesting, educational, and hopefully helpful.

I’d like to start by quoting two lines from Ernest Hemingway’s novel The Sun Also Rises, wherein Bill asks “How did you go bankrupt?” To which Mike responds “Two ways. Gradually, then suddenly.”

Most of us don’t like change, but fortunately, it usually occurs slowly. But, every now and then, events like Pearl Harbor, September 11th, and the Pandemic, come out of nowhere, and change everything suddenly.

With 20/20 hindsight we can look back at those events, and see some clues we just didn’t notice at the time. Change really did occur gradually, and then suddenly. 

With the benefit of hindsight, I’d like to take a look at some of the clues which were there for all to see, and share with you some of my observations on 1) how we got to where we are today, 2) where our economy is today, and 3) by knowing where we came from to where we are, should help bring some clarity to what the future may hold for us. Hopefully, this exercise will help set expectations for what we may expect from both our wages, and our investments. Plus, how it may affect our RVing lifestyles, and the prices of coaches in the future. Bottom line, I hope these three videos will help you make more informed decisions in the future. 

In this first video titled RVs, the Economy and You! UPDATE #2, Part One, I’ll start with a small primer on the Federal Reserve System. In order to understand prior Monetary Policies, and the actions the Federal Reserve has taken to bring us to where we are today, we will need a modicum of knowledge on how our Federal Reserve System functions.

In Part Two I’d like to delve a little deeper into six topics. And, I do emphasize the word a “little,” because an entire video could easily be devoted to each one of these topics, and it still wouldn’t do them justice. The six topics we’ll discuss in the second video are:

1. Monetary Policy 1 (MP1)

2. Monetary Policy 2, or “Quantitative Easing” (MP2) QE

3. Monetary Policy 3 (MP3), or “Helicopter Money”

4. Supply and Demand

5. Labor Force Participation

6. Stock Market

Topics one through three will cover what has brought us to where we are today, and topics four through six will bring clarity to where we are today. After a basic understanding of these six topics, we’ll cover what they portend for our future in the last video titled RVs, the Economy and You! UPDATE #2, Part Three.

Now let’s get started with our Federal Reserve system. Congress has specified three goals the Federal Reserve, while acting as our central bank, is to achieve. And, these goals are:

1. Maximum employment

2. Stable prices

3. Moderate long-term interest rates  

While the Federal Reserve, or “the Fed” for short, has several tools at their disposal, we’ll be discussing just four of the tools it uses to achieve its three goals. These tools are:

1. The Reserve Requirement 

2. Their Open Market Operations 

3. The Discount Rate

4. The Interest Rate on Excess Reserves

So, how do these four tools work, and how has the Fed used them in the past to get us to where we are today?

Let’s start with the definition of “reserves.” Bank reserves are the minimal amounts of cash a bank is required to keep on hand in case of an unexpected demand. Excess reserves are the additional cash a bank keeps on hand, and for whatever reason, has declined to loan those funds out. 

The Federal Reserve sets the Reserve Requirement for banks, which is simply the amount of money banks must keep on hand overnight. Banks can either keep their money in their vaults, or on deposit with the Federal Reserve who is our nation’s Central Bank. When the Fed sets a low reserve requirement it allows our banks to lend out more of their deposits, and is considered expansionary because it creates more credit. Conversely, when the Fed sets a high Reserve Requirement it is considered contractionary, because it results in banks having less money to lend, which constricts credit. It’s worth noting, the Fed rarely changes the Reserve Requirement, because it’s difficult for its member banks to modify their procedures on a dime. So this only occurs at the extremes.

Now, let’s discuss the Fed’s second tool, the Federal Open Market Committee, or the “FOMC.” The FOMC is frequently, if not almost continuously, conducting what’s called “Open Market Operations.” This is the primary tool the Fed uses to adjust our money supply. Prior to the Great Recession of 2008, Open Market Operations were where the Fed purchased and sold only government securities, which included, Treasury Bonds, Treasury Notes, and Treasury Bills.

Now, some of you may be asking; what is the difference between a Treasury Bill, a Treasury Note, and a Treasury Bond? And, the answer is maturities. Treasury Bills have a maturity of one year, or less. Treasury Notes have a maturity of two to ten years, and Treasury Bonds have a maturity of ten to thirty years.

And, for those of you who are unfamiliar with how bonds work, let’s take a minute to review. Bonds are typically issued by governments, municipalities, or corporations when they want to raise money. By buying a bond, you’re giving the issuer a loan, and they agree to pay you back the original face amount of the bond on a specified date, and to pay you periodic interest payments along the way, usually twice a year. Bonds with a fixed-rate coupon pay the same percentage of their face value over time, however, the market price of the bond will fluctuate as the coupon becomes more or less attractive when compared to prevailing interest rates.  

For example, let’s imagine a bond was issued with a coupon rate of 5%, and with a face amount of $1,000, or “par value.” The bondholder will be paid $50 in interest annually. Most bond coupons are split in half and paid semiannually. As long as the interest rate environment doesn’t change, the price of the bond’s par value will remain at its original face amount. But, given bonds are traded every second of every day the interest rate environment is constantly changing.

Let’s assume interest rates begin to decline, and similar bonds are now being issued with a 4% coupon, our original bond has become more valuable. Investors will now have to pay extra for our bond in order to entice us to sell. The increased price brings the bond’s total yield down to 4% for the new investor, because they had to pay an amount above our par value to purchase our bond.

On the other hand, if interest rates rise, and coupon rates for similar bonds are now 6%, our 5% coupon is no longer attractive. Our original bond’s price will decrease, and begin selling at a discount compared to our par value until its effective return is 6%.

Now, getting back to the Fed’s Open Market Operations. All purchases and sales of Treasuries by the Fed, are carried out by the Federal Reserve Bank of New York through its Primary Dealers. When the Fed purchases Treasury Securities, four things happen:

1. Our Central Bank is creating more demand for those Treasuries, which in turn drives their prices higher.

2. As the prices rise the yield on those Treasuries drops, and it has the affect of reducing interest rates across the board of similar maturities.

3. As the Central Bank purchases these Treasury Securities they are taking these securities out of the market place, and replacing them with cash.

4. This new cash, or reserves as they are sometimes called, gives our banks more money to lend.

Now, when our Central Bank is purchasing Securities, it is considered to be an expansionary monetary policy, or the Fed is being accommodative.

When our Central Bank is selling Treasury Securities from their balance sheet, it all happens in reverse:

1. Our Central Bank is adding to the existing supply of Treasury Securities in the market place, which in turn drives their prices lower.

2. As prices drop, the yield on those Treasuries increases, and has the affect of raising interest rates across the board on similar maturities.

3. As the Central Bank sells their Treasury Securities they are adding those securities to the market place, and pulling cash back out of our banking system.  

4. This reduction in cash leaves our banks with less money to lend.

When our Central Bank is selling Treasury Securities, it is considered to be executing a tight monetary policy.

This entire process is frequently referred to as “printing money,” because our Federal Reserve, acting as our country’s Central Bank, is the only entity who can buy securities without having cash in their account. Instead, the Fed just credits the selling bank’s account, which is how they have expanded our money supply over time.

Number next, let’s discuss the Fed’s third tool, the Discount Rate. The Discount Rate is the rate our Central Bank charges member banks to borrow at its “Discount Window.” Because the Discount Rate is higher than the Fed Funds rate, banks only borrow at the “Discount Window” if they can’t borrow funds from other banks through what’s called Fed funds. Using the Discount Window has always had a negative stigma attached to it, as the financial community assumes any bank who borrows from the Discount Window is in trouble. After all, only a desperate bank who has been rejected by all other banks in the Fed Funds market would use the discount window.

Now for the final tool we will discuss, which is the Interest Rate on Excess Reserves. And, I will confess, I have zero experience with this tool of the Fed, as it didn’t exist back during the years when I owned a bank. Interest Rate on Excess Reserves was created in response to the Great Recession of 2008. Since October 6th, 2008 the Federal Reserve has paid interest on any excess reserves our country’s banks may have on deposit with the Fed. Remember, money always flows to where it’s best treated. So, if the Fed wants banks to lend more money, it lowers the rate it pays on their excess reserves below the rate they can earn by lending. Conversely, if the Fed wants banks to lend less, it raises the rate it pays on their excess reserves.

It’s probably worth noting, interest on excess reserves also supports the Fed Funds rate. And, you’re probably asking how? Well, at the close of business everyday banks either have excess reserves, cash they haven’t lent, or they’re short cash. These excesses and shortages zero themselves out on a nightly basis with overnight Fed Funds. If you’re a bank with excess cash, you want it earning interest at all times. You don’t want your cash sitting idle overnight, because as a bank you are paying interest to your depositors every night. Interest never sleeps. So, you’ll lend your excess cash to other banks who are in need of cash to balance their accounts. These funds are lent through a regional Federal Reserve Bank in what is commonly referred to as “Fed Funds.” 

Now, if I’m a bank with excess cash, and the Fed is paying me more for my Excess Cash than other banks are willing to pay through Fed Funds, well I’ll lend my money overnight to the Fed. And, vice versus. If other banks are willing to pay a higher rate than the Fed for my excess cash, then I’ll lend my excess cash to other banks through Fed Funds. So, this is how the Fed uses interest on excess reserves to help support the Fed Funds rate.

Bottom line, the Federal Reserve, acting as our country’s Central Bank, uses the tools we’ve just discussed to increase or decrease our nation’s total liquidity, which is the amount of capital available to invest or lend.

With this little primer on the Federal Reserve under our belt, we can discuss what the impacts have been to our economy as a result of the Fed’s open market operations over the past 14 years in RVs, the Economy and You! UPDATE #2, Part Two video.

Thank you for listening to my ramblings, and if you’re still awake, I’ll continue my musings in the next video.